What does the service do?
In a nutshell, each day the system waits for you to load your portfolios of trades or positions, and supporting rates. When the loads are complete the system automatically runs your risk calculations and produces reports which you can absorb into your daily risk reporting.
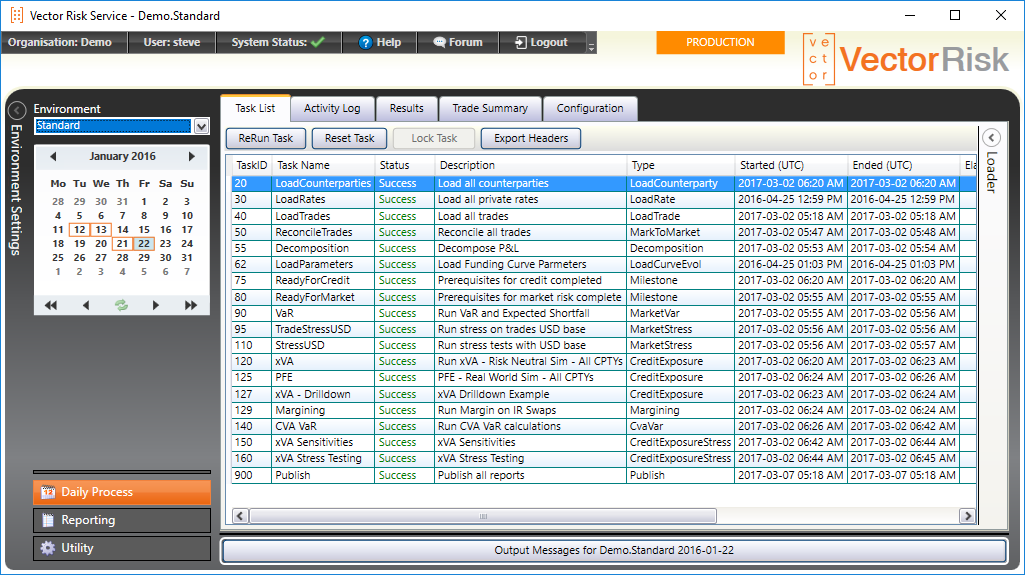
This automation is made possible by the task list, a set of tasks customised to your organisation which run in a prescribed order according to dependencies that are set between them. An example task list can be seen in the diagram above.
To trigger the daily process simply call Vector Risk’s load web services with xml or csv files that conform to the Vector Risk load format - see the section Loading Data for more details.
No matter what calculations you run you will typically load trades and rates and then a Mark to Market on all your trades, and reconciliation with a front office price. This verifies that the Vector Risk valuations match the bank's internal valuations, and provides a solid foundation for the rest of the analytic services.
If you are using the service for traditional market risk you will typically run:
- VaR (value at risk using historic or Monte Carlo simulation).
- Back testing
- Stress tests.
If your organisation is signed up for credit risk you will also load counterparty and collateral details and the system will run:
- CVA (credit valuation adjustment).
- PFE (potential future exposure).
- Margining (verifying the margin call from an exchange on your derivatives portfolio).
- Pre-deal checks (real-time exposure calculations initiated by your trading and limits system).
- Decomposition (P&L explain from one day to the next).
- Stress tests.
- Hedge Effectiveness
- Loan Impairment
- Standardised preparation (sensitivity generation) or sensitivity load.
- Standardised approach (delta, vega, curvature, default risk. residual risk).
- FRTB compliant expected shortfall simulations on internal model desks.
- Internal model default risk charge.
- Internal model SES (stressed expected shortfall) on non-modellable risk factors (NMRF).
- Desk level and global VaR and backtesting and compliance monitoring.
- Desk level actual and hypothetical P&L load, and P&L attribution compliance monitoring.
- Final capital calculation (combining SA and IMA desk capital, and accounting for the SA floor).
This screenshot above shows an example of a task list. The task list represents a workflow customised to fit an organisation’s unique data feeds and calculations. The calendar shows that this workflow is for the position as at the 22nd January 2016.
The last task includes one or more Publish tasks. If these task have completed all of your reports have been published and are available for viewing or download.
All done, Publish was successful!
Surely, you say, there must be more to it than that! Well yes, behind the configuration tab is a business unit hierarchy tailored to your organisation, and definitions of all the parameters needed to control the simulations. The Vector Risk team tailors these configuration files to your needs and of course facilitates changes as your analytic needs get more sophisticated. These settings are all explained in the User Manual. What you’re really interested in though is the final set of reports.
Reporting
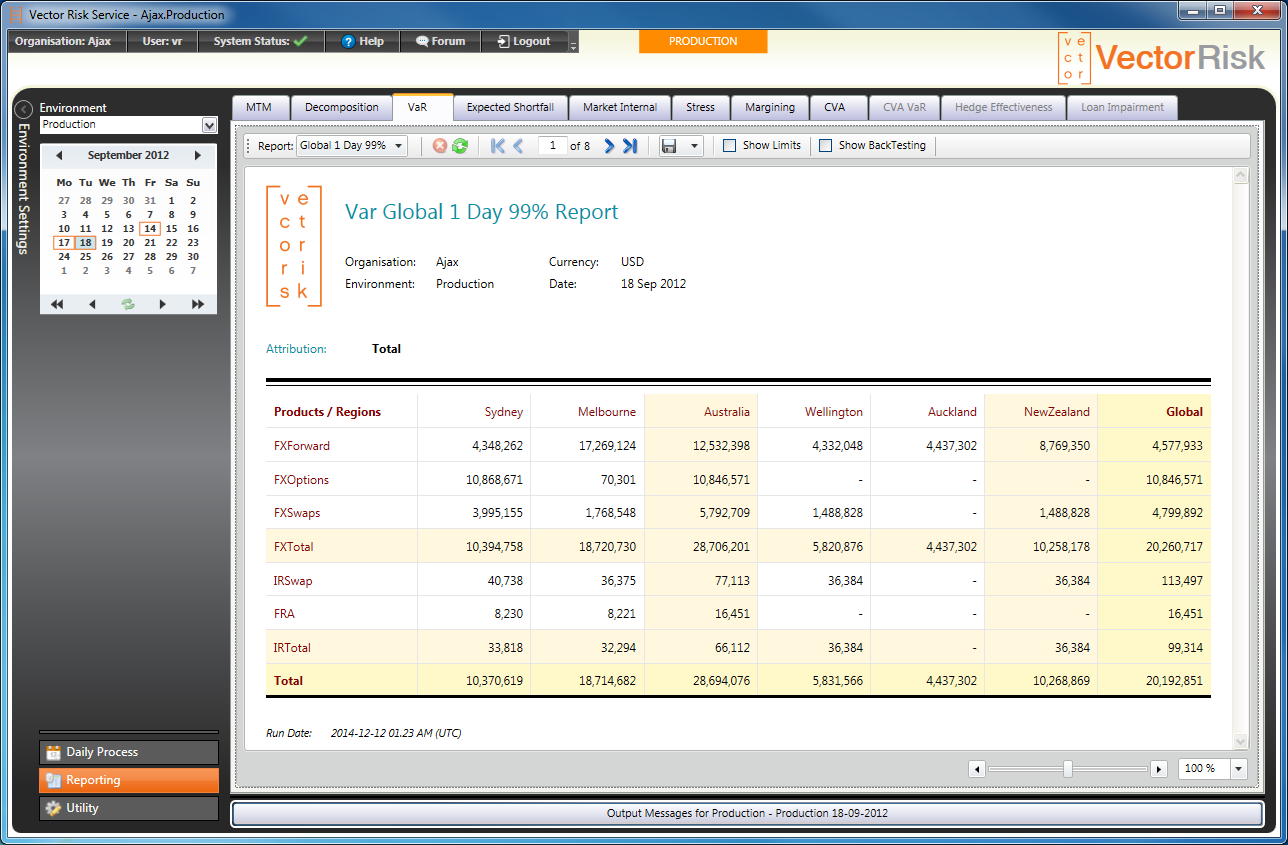
The report shown here is for a VaR calculation that has been run for different cross-sections of your portfolio, highlighting concentrations of risk that you may not have even been aware of. The VaR report above actually has several pages. The page shown is for “Total” risk, but the system also breaks down (or attributes) the risk into markets (FX, Equities, Commodities, Interest Rates, Credit Trading).
Reports can be saved to Excel or PDF. In addition a copy in CSV format is automatically placed in a secure URL location so your tech team can automate the collection of the results for inclusion in internal reporting processes.