Articles in this section

Introduction
Data can be loaded in csv or xml format.
For the first time user the simplest approach is to use a spreadsheet to collate some data, save to csv and use the Vector Risk GUI to manually load the data. The headers for these CSV files can be downloaded from the GUI. This process is explained in the section 'Loading CSV Data' below but if you are just starting out you may find it wothwhile to do the Load Tutorial.
In a production setting there are two approaches that enable straight through processing between your organisation's systems and the risk service. These are described in the section Automated Loading.
Data Sets
The main data sets to be loaded are the trade or position data and any market rates not already available in the service. If you are running historic VaR you will need rate history for your private rate sets.
If you are running credit calculations you will need to load counterparty details including details of any collateral agreements.
The Monte Carlo simulations require curve evolution parameters such as volatility and correlation. These can be loaded directly or generated from historic rate data.
There are also APIs for loading the following:
- Default risk inputs for the calculation of FRTB IMA default risk (obligor probability of default and default correlations, as well as jump to default (JTD) values for each obligor.
- P&L, both actual and hypothetical for inclusion in FRTB IMA back testing and P&L attribution.
- FRTB SA sensitivities can be calculated in front office systems. This API follows the FRTB SA sensitivity definitions (GIRR, CSR x 3, Equity, Commodity and FX), along with inputs for FRTB SA default risk and residual risk calculations.
- VaR Vectors can be loaded directly where scenarios have been run in the front office. These may be blended with vectors generated by the Vector Risk analytics in order to form complete expected shortfall results for FRTB IMA capital.
- A special "Sensitivity" product allows complex trades to be loaded as a set of sensitivities to market factors. These sensitivities can be delta/gamma values on each risk factor, or a grid of sensitivities across two risk factors. The "product" valuation uses the sensitivities to estimate Mtm under any of the scenarios (VaR or stress) making up FRTB SA or IMA calculations.
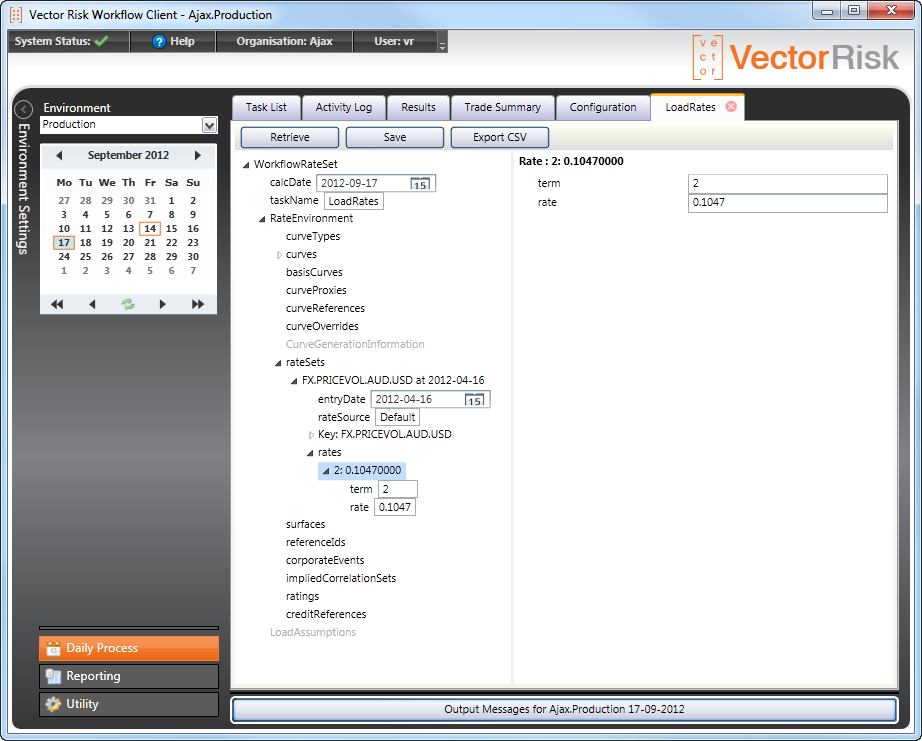
Viewing and Editing Loaded Data
Once a load task has successfully completed you can double click on its row in the task list to open a viewer to the data. The example below shows a 'LoadRates' view. The pane on the right is an editor, so a user with the 'Load' role is able to fix a rate (or trade etc) in the load view and save the edited data back to the system.
Exporting Data
Data that has been successfullly loaded to the system can be exported to a file. Data loaded in CSV format can be exported as XML and vice versa.
To do this, identify a load task in the task view (opening page of the GUI) that you would like to export from, that has a status of "Success". Double click on this task row and a viewer tab will open. Hit the retrive button in the viewer to see the data represented as a tree.
To export this data as a CSV file hit the "Export CSV" button.
To export this data as an XML file right click on the top node in the tree and select "Save XML".