Configuration
The configuration files that affect stress calculations are:
| Configuration File | Details |
| TaskList | The MarketStress task type is used. |
| Assumptions | Base assumptions common to all calculations. |
| BusinessUnits | The books that trades are attached to and the relationships required to aggregate results at intermediate and total levels. |
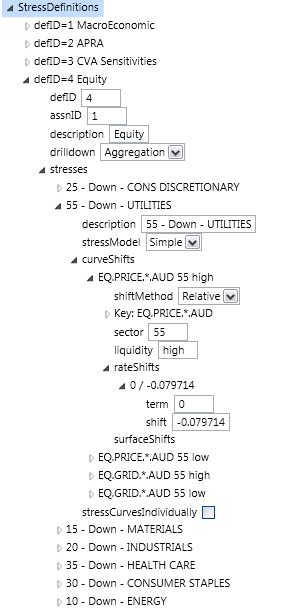
| StressDefinitions | A collection of stress tests. Each stress test can specify shifts on one or more curves either by identifying each curve or using wildcards. Shifts can be an absolute amount or a relative amount (to the current rate). |
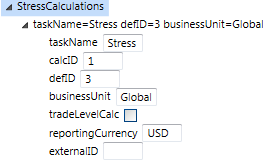
| StressCalculations | A calculation specifies a task name, business unit and StressDefinition. Results are generated for each calculation specified. |
Stress Definition
Stress Calculation
The example stress calculation below shows a calculation to be the linkage between a business unit, a task and a stress definition. These elements combine to allow calculations to be run by the system.
Stress tests can be applied to any market data, though the example above shows an equity stress test definition. In this example equity curves are stressed. Note the asterisk wildcard in the curve key signifying all AUD stocks (or AUD equity prices). The sector and liquidity settings are useful for categorising equities. Typically the sector would use GICS codes, and stocks with low liquidity would be subject to larger shifts.
A stress test can shift a single curve or multiple curves. If the curve contains a term structure the stress test can include multiple points to induce parallel, skewed or parabolic shifts. Stress tests can be flagged to stress curves individually or all at once. Volatility surfaces and other 2D market data can have parallel shifts applied to them.
Viewing Results of a Stress Calculation
Opening a successful stress task from the summary page, a user can select a particular calculation to view its results. Here is a sample result:
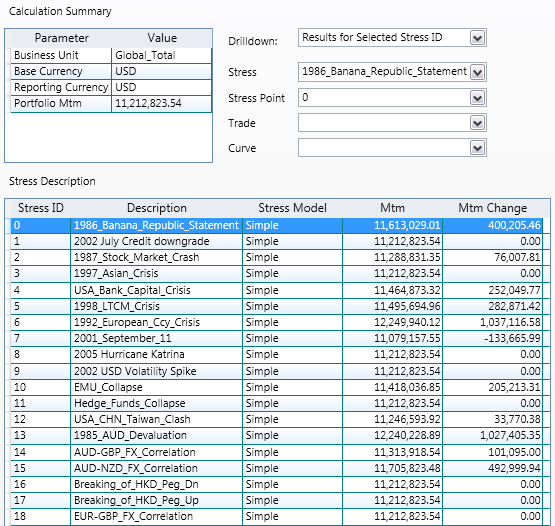
The dropdown menu top right allows the user to select the following drilldown views:
- Results for Selected Stress ID (shown above)
- Trade mtm and rates on selected Stress ID
- Rate shifts on selected Stress Point
- Trade mtm and rates by Stress Point for Selected Trade
This large body of drilldown information is held in the risk engine’s results database. Typically, most of this information will not be generated in the production run. The policy is usually to wait until there is an issue before switching drilldown on and re-running the calculation.
Also appearing in the results viewer is a treeview containing all of the data required to re-run the calculation. This is where a user can prepare a re-run of the calculation with extra drilldown switched on.
Business Unit Hierarchy
The business unit configuration file contains three types of object:
Books
These are the lowest level trading books. Every trade that is loaded to the system has a 'book' attribute that must match one of the books in the business units configuration file.
Desks
These are simple roll-ups of books to a level representing the lowest reporting level. If you intend to report at the book level there may be no need to set up any desks.
Grid Hierarchies
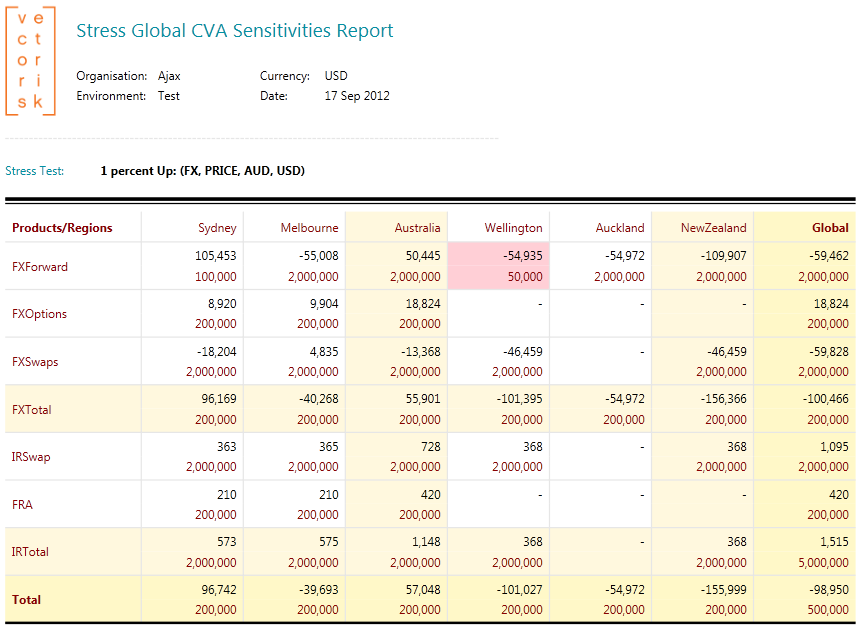
This structure defines the grid elements and rollups (intermediate and total) for a MarketInternal report. Refer to the sample below. The lowest level (grid elements) must come from the book and aggregation lists. They are given X and Y co-ordinates in the grid report. Rollups are then defined via parent linkages on the X and Y axis. The end result is a Stress grid report like the one shown below.
It is also possible to include limits in a grid hierarchy. This optional feature is described in the Limits section below.
The grid hierarchy object can contain limits for Var, Expected Shortfall and Stress calculations (all of which may be running against the same grid hierarchy). Limits are saved as a list of numbers in the grid hierarchy. The list should correspond to the grid report, one limit per cell in column/row order. The numbers should be in the reporting currency. They can be represented as complete numbers or with lowercase or uppercase suffixes. Examples:
- 1.5 million can be written as 1500000 or 1.5M or 1.5m
- 24,000 can be written as 24000 or 24T or 24t or 24K or 24k
There is a checkbox in the report toolbar to show exposure against limits. Limit breaches occur when the Stress is negative and its absolute value is greater than the limit. Note: By convention limits are shown as positive numbers but are compared against negative stress results that represent a potential loss. Any exposures that breach a limit are shaded red as in the example below.