Configuration
The configuration files that affect Value At Risk (Var) calculations are:
| Configuration File | Details |
| TaskList | The MarketVar task type is used to run Var calculations. |
| Assumptions | Base assumptions common to all calculations. |
| BusinessUnits | The books that trades are attached to and the relationships required to aggregate results at intermediate and total levels. |
| VarDefinitions | Classic VaR settings (confidence, horizon and attributions) plus the choice of methodology (historic simulation or monte carlo) and associated settings such as the number of historic or random scenarios respectively. |
| VarCalculations | A calculation specifies a task name, business unit and VarDefinition. Results are generated for each calculation specified. |
Note: Expected shortfall (ES) is a very close relative of Var, and its configuration is identical. So this section applies equally to Var and ES.
In order to run a Var calculation we need to do the following:
- Create a MarketVar task in the task list.
- Create a VarDefinition (see detailed description below) and assign it with id=1.
- Create a VarCalculation that links a business unit (book or aggregation or "grid hierarchy") with our var definition (id=1), and is assigned to our Var task.
Var Definition
The assumptions driving the var calculation are in a configuration file called VarDefinitions. Both Historic Var and Monte Carlo Var are supported(*). A sample Historic Var definition can be seen below left; and a Monte Carlo Var definition can be seen below right.
(*) Historic Simulation supports aggregation to higher levels in the business unit hierarchy by summing portfolio Mtms at the scenario level. Monte Carlo does not support this aggregation ability so a full Monte Carlo must be run at each level in the hierarchy.
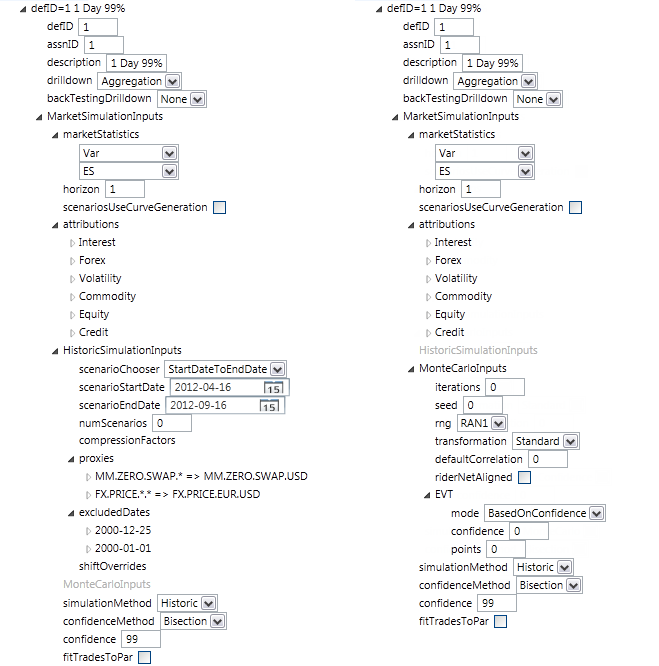
Note: See the section Historic Simulation in the Analytic Reference for discussion of how the above settings affect the derivation of historic scenarios.
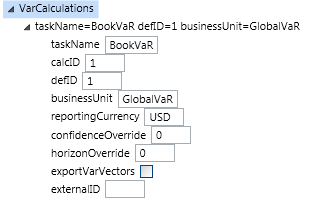
Var Calculation
The example Var calculation below shows a calculation to be the linkage between a business unit, a task and a Var definition. These elements combine to allow calculations to be run by the system.
Viewing Results of a Var Calculation
Opening a successful var task from the summary page, a user can select a particular calculation to view its results. Here is a sample result from a historic simulation:
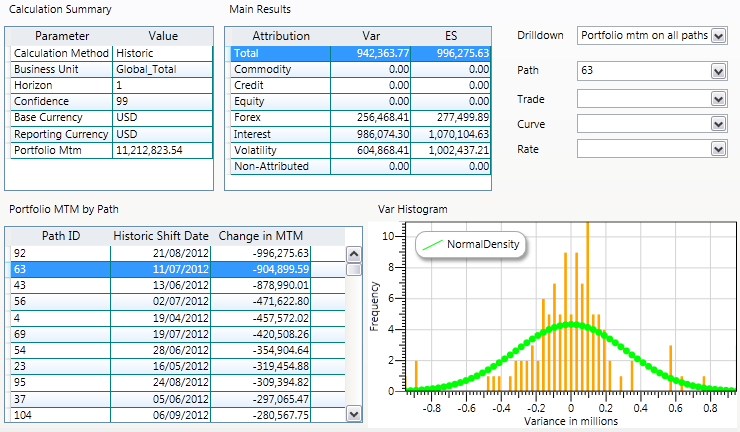
The dropdown menu top right allows the user to select the following drilldown views:
- Portfolio mtm on all paths (shown above)
- Trade mtm and rates on selected path
- Rate shifts on selected path
- Trade mtm and rates for selected trade on all paths
- Historic shift details for selected rate on all paths
This large body of drilldown information is held in the risk engine’s results database. Typically, most of this information will not be generated in the production run. The policy is usually to wait until there is an issue before switching drilldown on and re-running the calculation.
Also appearing in the results viewer is a treeview containing all of the data required to re-run the calculation. This is where a user can prepare a re-run of the calculation with extra drilldown switched on.
Business Unit Hierarchy
The business unit configuration file contains three types of object:
Books
These are the lowest level trading books. Every trade that is loaded to the system has a 'book' attribute that must match one of the books in the business units configuration file.
Desks
These are simple roll-ups of books to a level representing the lowest reporting level. If you intend to report Var at the book level there may be no need to set up any desks.
Grid Hierarchies
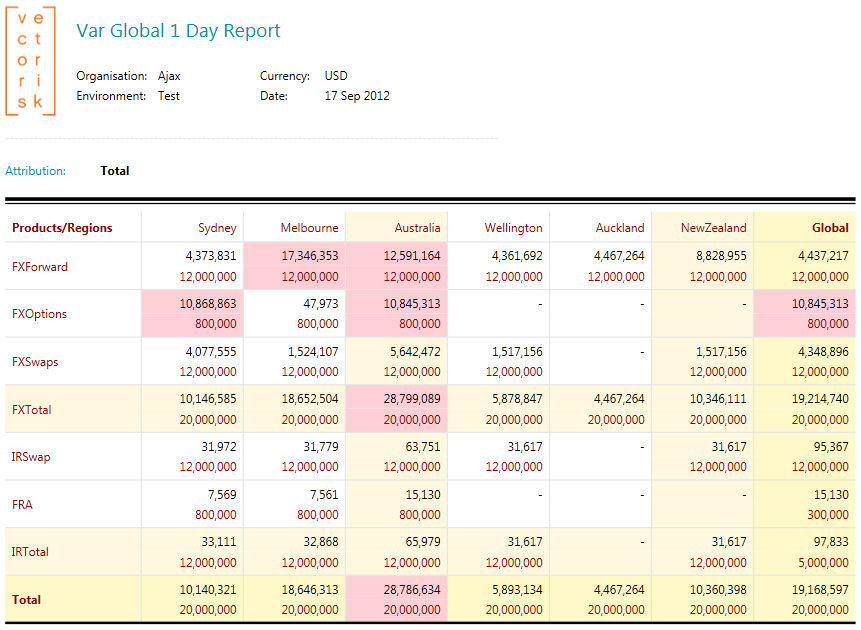
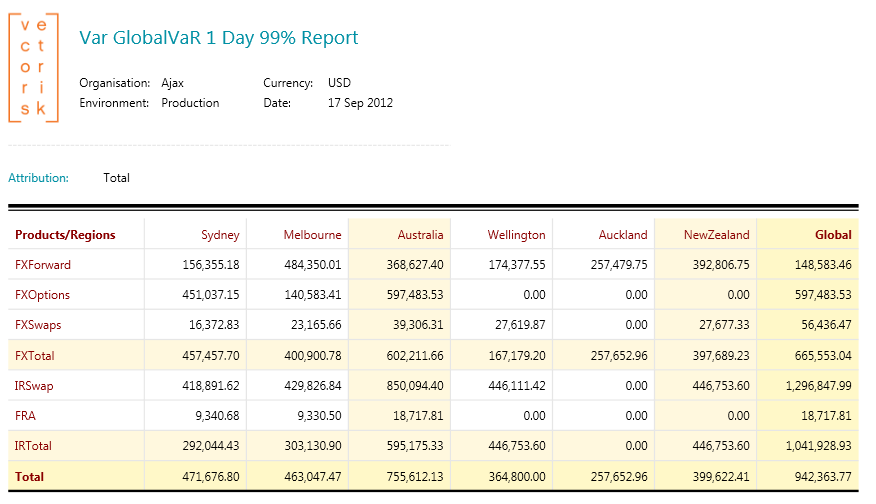
This structure defines the grid elements and rollups (intermediate and total) for a Var report. Refer to the sample below. The lowest level (grid elements) must come from the book and desk lists. They are given X and Y co-ordinates in the grid report. Rollups are then defined via parent linkages on the X and Y axis. The end result is a Var grid report like the one shown below.
It is also possible to include limits in a grid hierarchy. This optional feature is described in the Limits section below.
Limits
The grid hierarchy object can contain limits for Var, Expected Shortfall and Stress calculations (all of which may be running against the same grid hierarchy). Limits are saved as a list of numbers in the grid hierarchy. The list should correspond to the grid report, one limit per cell in column/row order. The numbers should be in the reporting currency. They can be represented as complete numbers or with lowercase or uppercase suffixes. Examples:
- 1.5 million can be written as 1500000 or 1.5M or 1.5m
- 24,000 can be written as 24000 or 24T or 24t or 24K or 24k
There is a checkbox in the VaR and Expected Shortfall report toolbars to show exposure against limits. Limit breaches occur when the VaR or ES (by convention a positive number) is greater than the limit. Any exposures that breach a limit are shaded red as in the example below.