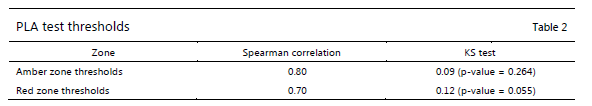
P&L attribution is the application of two tests on IMA desks to compare the hypothetical P&L from the trading system against the theoretical P&L calculated in the risk system. Each months bloc of results is entered into two tests, called the "Spearman Correlation" test and the "Kolmogorov-Smirnov" test.
The P&L attribution task collects the most recent 250 results from the previous year's worth of daily runs in order to determine if the desk is passing the requirement and can continue as an IMA desk (Green or Amber zone), or must revert to a standardised desk (Red zone). The desk's zone is determined by the worst of the two test results.
Viewing Results of a P&L Attribution Calculation
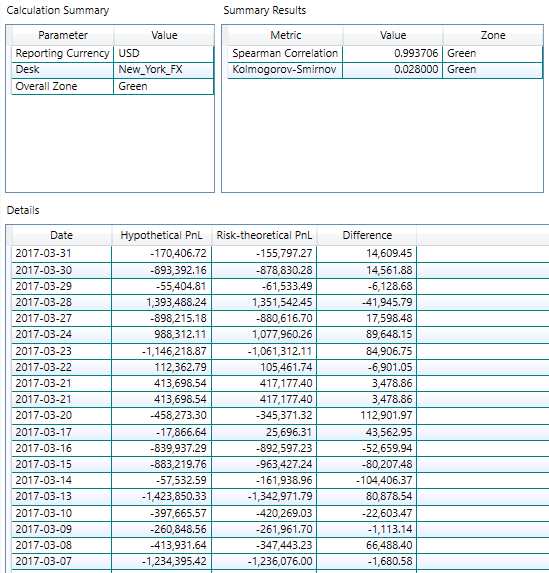
Opening a successful PLAttribution task from the summary page, a user can select a particular calculation (desk) to view its results. Here is a sample result:
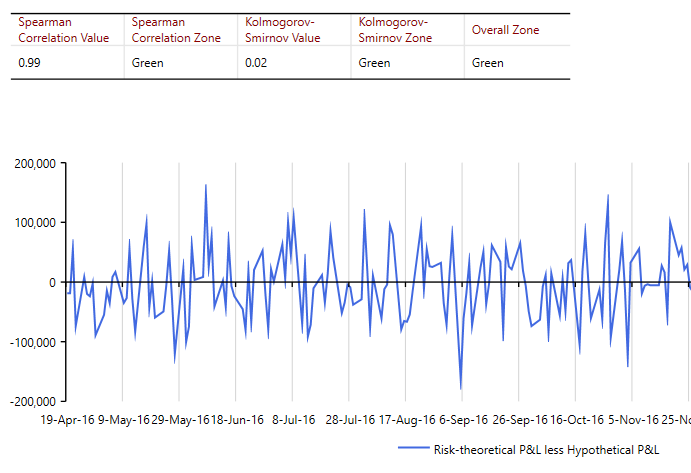
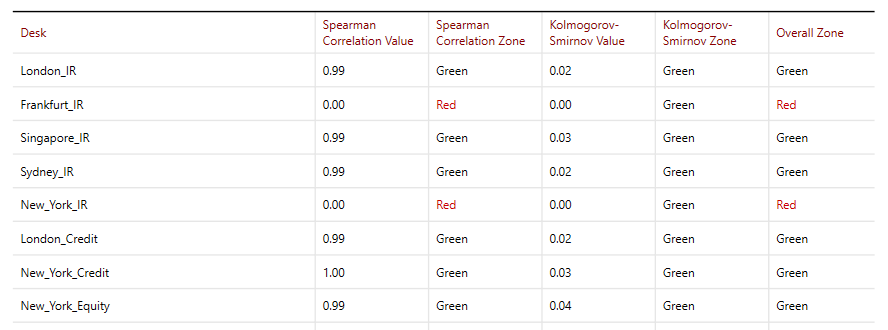
The system reports P&L Attribution results at the summary level (a list of desk results), and at the individual desk level where a graph is produced (report extracts below).
Summary Report
Detail Report