Configuration
The configuration files that affect Market Internal (IMA) calculations are:
| Configuration File | Details |
| TaskList | The MarketInternal task type is used to run FRTB IMA calculations. |
| Assumptions | Base assumptions common to all calculations. |
| BusinessUnits | The books that trades are attached to are organised into desks for calls to the risk engine. |
| MarketInternalDefinitions | The parameters required to run IMA expected shortfall are many. Some of the most important are the stress period and included risk factors, risk class definitions (attributions), non-modellable risk factors, confidence (97.5) and horizon (10 day overlapping). Details below. |
| MarketInternalCalculations | A calculation specifies a task name, business unit (or hierarchy) and MarketInternalDefinition. Results are generated for each calculation specified. |
In order to run a MarketInternal calculation we need to do the following:
- Create a MarketInternal task in the task list.
- Create a MarketInternalDefinition (see detailed description below) and assign it with id=1.
- Create a MarketInternalCalculation that links a business unit (desk or "grid hierarchy") with our definition (id=1), and is assigned to our task.
Market Internal Definition
The assumptions driving the market internal calculation are in a configuration file called MarketInternalDefinitions.
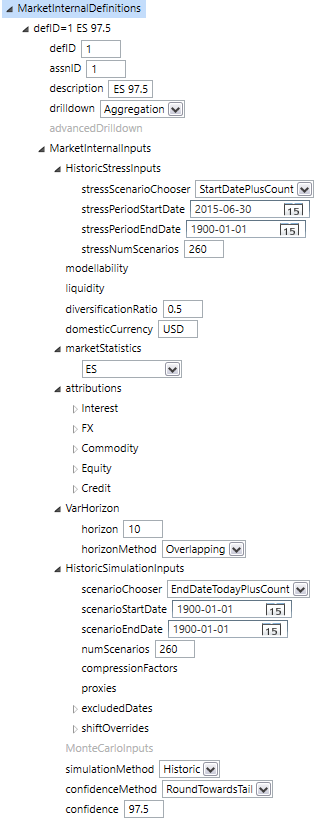
Note: See the section Historic Simulation in the Analytic Reference for discussion of how the above settings affect the derivation of historic scenarios.
Non-Modellable Risk Factors, and the Reduced Factor Set
An important part of the expected shortfall calculation is the categorisation of risk factors. A risk factor may take one of three values:
| Factor Set | Description |
| Non-modellable | There is no valid history for these variable so they are held constant in the simulation. Capital is allocated by running SES (stress expected shortfall) in a separate workflow task. |
| Partial History | Valid history exists for the most recent year which means this risk factor can be included in the ESFC simulation, and the results will be part of the scaling factor to be applied to the ESRS results. |
| Full History | Valid history exists for the last 10 years (a conservative way of saying that no matter where the calibration process finds the stress period to lie, this risk factor can be included in the ESRS simulation). |
The system must have a way to assign these categories to all of the risk factors associated with the internal model calculations. This requirement is handled with a two-pronged approach summarised as follows:
Firstly, each risk factor is represented in the market data by a curve definition which includes a "Modellability" field that must take one of the three values listed in the table above.
Secondly, there is a "Modellability" element in the definition file above. This element allows risk factors, or risk factor wildcards to be listed along with the relevant value (of the three allowed). This element takes precedence over the value assigned in the market data.
The two-pronged approach has the merits of being easy to manage (keeping the factor set stored directly with the risk factors (ie their "Curve" definitions), whilst allowing for complete flexibility by allowing a calculation to override any of the values.
Liquidity
The IMA calculation requires sub-calculations of expected shortfall based on the Liquidity Horizon of the risk factors, starting with a calculation including all risk factors and successive calculations including factors of less liquidity.
In contrast to the Modellability value above, the Liquidity Horizons of different market factors can be determined by the elements in the Curve Key (market, curve type, asset, currency). This categorization is included in the system and stored in the risk engine database. The "Liquidity" element in the definition allows risk factors, or risk factor wildcards to be listed along with the relevant value. This element takes precedence over the value assigned in the database table.
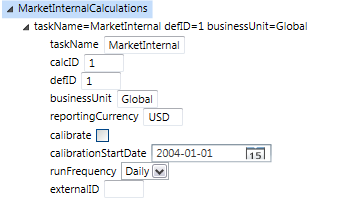
Market Internal Calculation
The example calculation entry below shows a calculation to be the linkage between a business unit, a task and a MarketInternal definition. These elements combine to allow calculations to be run by the system.
Viewing Results of a MarketInternal Calculation
Opening a successful MarketInternal task from the summary page, a user can select a particular calculation to view its results. Here is a sample result:
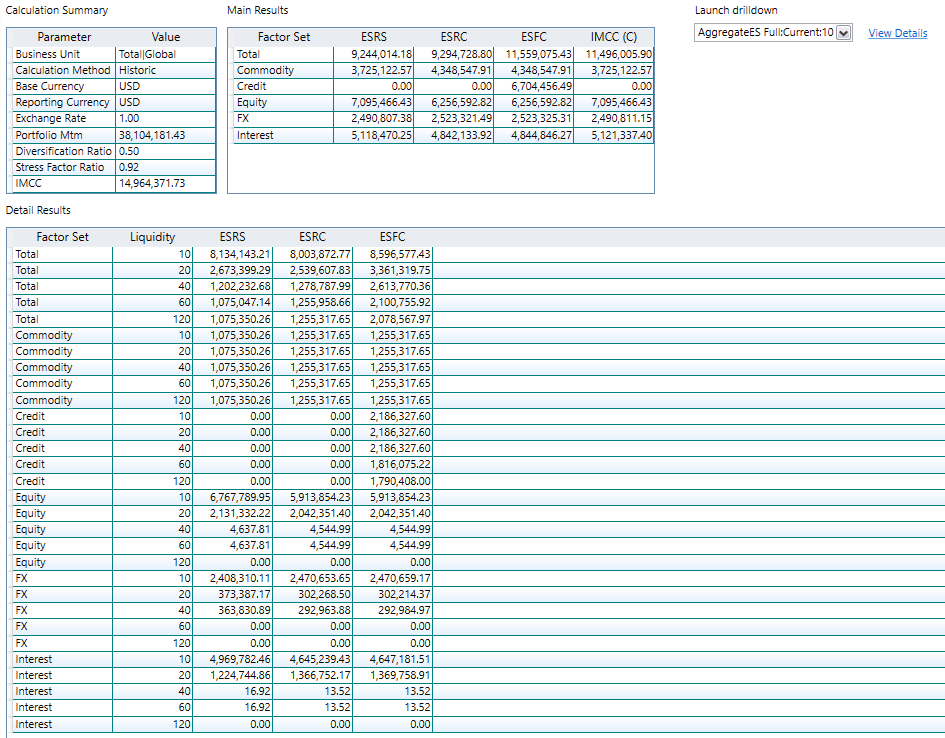
The main results screen shows expected shortfall results for each factor set; for specific liquidity levels in the Detail Results pane, and combined liquidity levels in the Main Results pane. In both panes the three separate simulations reduced stress (ESRS), reduced current (ESRC), and full current (ESFC) are represented. The Main Results pane also shows the resultant IMCC(C) results for each factor set, calculated by scaling the ESRS result by the ratio ESFC/ESRC.
The dropdown menu top right allows the user to launch views of the underlying historic simulations:
- Full Current: simulation of the full portfolio over the current history set (most recent one year of history).
- Reduced Current: simulation of the reduced portfolio over the current history set (most recent one year of history).
- Reduced Stress: simulation of the reduced portfolio over the stress history set (most volatile one year of history, most likely corresponding to the GFC).
Once a user launches one of these sub-calculations it is possible to view a large body of drilldown information that is held in the risk engine’s results database. Typically, most of this information will not be generated in the production run. The policy is usually to wait until there is an issue before switching drilldown on and re-running the calculation.
The drilldown available for Internal Model calculation mimics that for standard historic Var and expected shortfall calculations. A discussion of these drilldown options can be found in the section VaR & Expected Shortfall.
Also appearing in the results viewer is a tree view containing all of the data required to re-run the calculation. This is where a user can prepare a re-run of the calculation with extra drilldown switched on.
Business Unit Hierarchy
The business unit configuration file contains three types of object:
Books
These are the lowest level trading books. Every trade that is loaded to the system has a 'book' attribute that must match one of the books in the business units configuration file.
Desks
These are simple roll-ups of books to a level representing the desk level for the purposes of FRTB. Nb: If a book already represents a whole desk there is no obligation to create a roll-up (of one book). The book can be used directly to represent a desk in the Grid Hierarchy below.
Grid Hierarchies
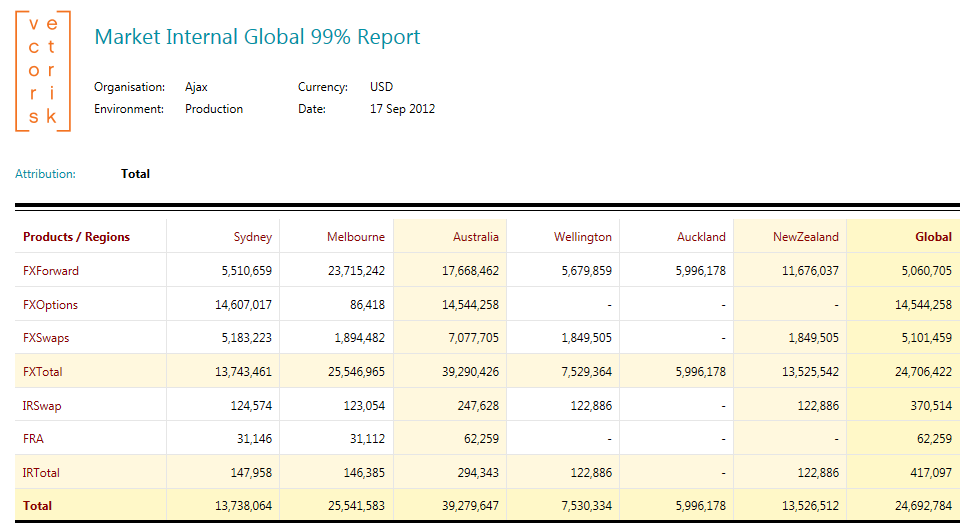
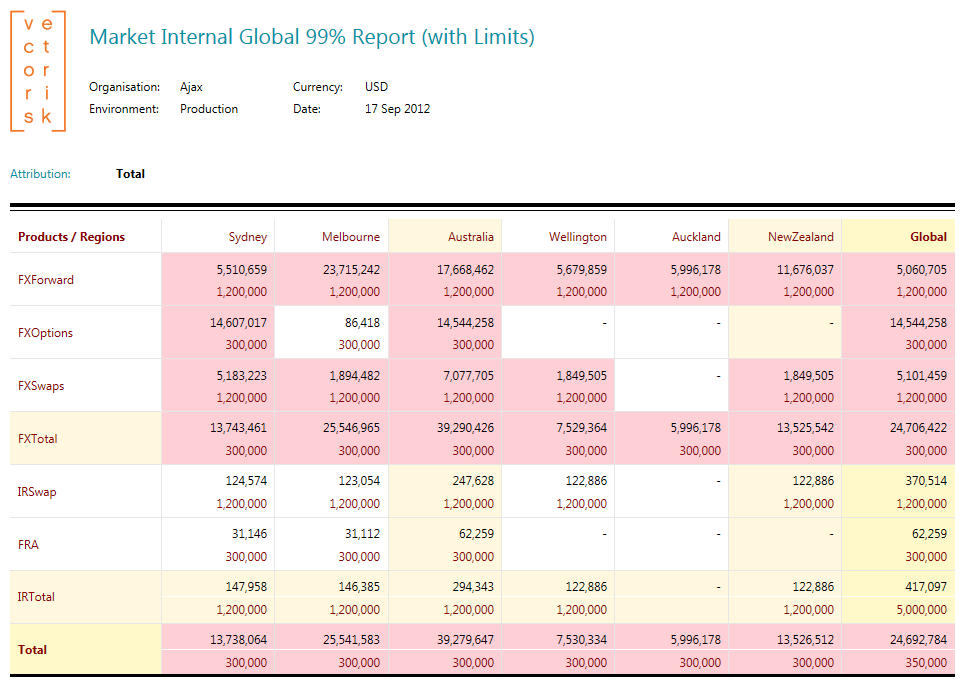
This structure defines the grid elements (desks) and roll-ups (intermediate and total) for a MarketInternal report. Refer to the sample below. The lowest level (grid elements) must come from the book and desk lists. They are given X and Y co-ordinates in the grid report. Roll-ups are then defined via parent linkages on the X and Y axis. The end result is a MarketInternal grid report like the one shown below.
It is also possible to include limits in a grid hierarchy. This optional feature is described in the Limits section below.
Limits
The grid hierarchy object can contain limits for Var, Expected Shortfall and Stress calculations (all of which may be running against the same grid hierarchy). Limits are saved as a list of numbers in the grid hierarchy. The list should correspond to the grid report, one limit per cell in column/row order. The numbers should be in the reporting currency. They can be represented as complete numbers or with lowercase or uppercase suffixes. Examples:
- 1.5 million can be written as 1500000 or 1.5M or 1.5m
- 24,000 can be written as 24000 or 24T or 24t or 24K or 24k
There is a checkbox in the VaR and Expected Shortfall report toolbars to show exposure against limits. Limit breaches occur when the VaR or ES (by convention a positive number) is greater than the limit. Any exposures that breach a limit are shaded red as in the example below.
(*) The MarketInternal report will only apply ES limits.
Calibration
One of the requirements of the internal model is that the most volatile year of history should be used for the stressed ES calculation. It is possible to set up a calibration version of the calculation that does just that. Simply set the calibration flag and CalibrationStartDate in the MarketInternalCalculation configuration file and the following will occur:
The system will run a historic simulation covering the whole period from the calibration start date up to today. This could be a period of 10 years or more. Once all the portfolio Mtms have been calculated the system works out the expected shortfall (ES) for the global portfolio for each contiguous one year history set. It finds the maximum ES from all of these results. The start and end date of the year of history representing this maximum ES is automatically saved in the configuration file that will be used in the market internal calculation from the next day forward.
The calibration task can be set to run daily, weekly or monthly.