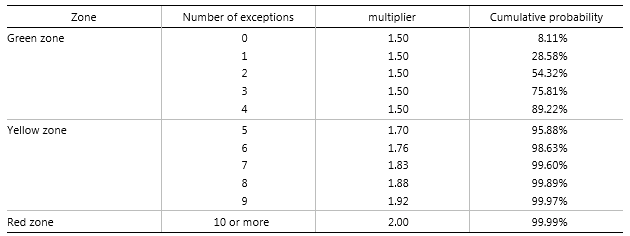
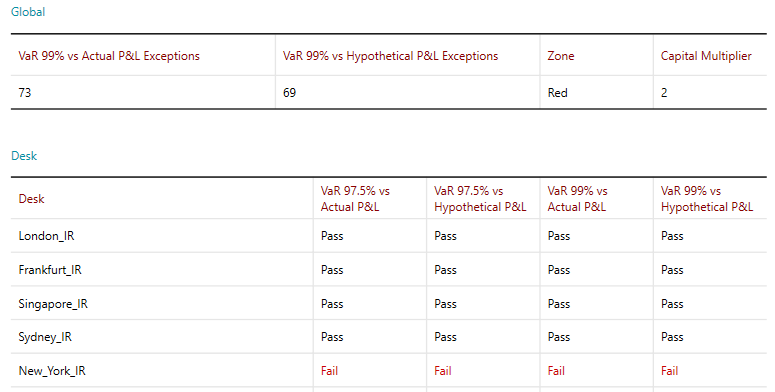
Two back tests are run on the total IMA portfolio. Both tests are run for the 99% confidence interval, one against actual P&L and the other against theoretical P&L. The capital multiplier described in the "Total Capital" section is determined by the worst outcome of these two tests according to the following table:
Four back tests are run for each desk; one for each combination of 97.5% or 99% confidence, and actual or theoretical P&L.
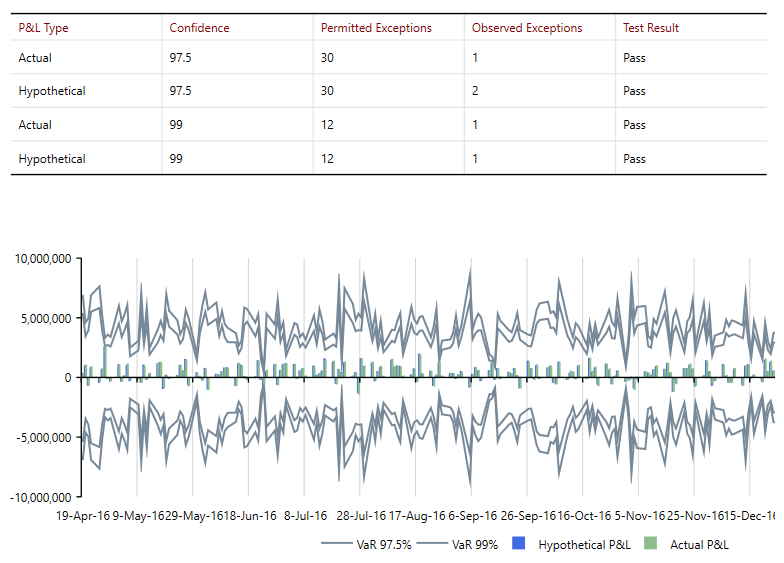
The "97.5%" tests are allowed up to 30 breaches per year, and the "99%" tests can have up to 12 breaches per year. If the allowed number of breaches is exceeded, the desk in question must revert to the standardised approach until the number of breaches in the most recent year of testing falls below the threshold.
The VaR calculations are performed by setting up VaR tasks which are described in the "VaR" section of this user guide under "Market Risk Calculations".
The configuration file "VarCalculations" includes a checkbox "frtbBackTesting" which must set to true. This ensures that the VaR calculation observes FRTB curve modellability rules. The configuration file also includes a parameter drop-down called frtbFilter. This parameter must be set to "InternalDesksOnly" for these particular VaR calculations.
The back testing task looks at data and results from VaR and load P&L tasks in its dependency list. Referring to the sample task list on the "FRTB" page, it can be seen that the back testing task is dependent on two VaR tasks (97.5% and 99%) and two load P&L tasks (actual P&L and theoretical P&L).
The back testing task collects the most recent 250 results from the previous year's worth of daily runs in order to determine if the desk is passing the requirement and can continue as an IMA desk. The combined desks calculation uses the same observation period.
Pre-production scaling
If there are less than 250 observations for a given desk or total result the default behaviour is just to count the number of failures as normal. However, the system can be set up to generate extra back testing data with the same mean and volatility as the observed results. This leads to an "indicative" number of exceptions over a year, and an "indicative" pass or fail for the desk. It allows a bank to get a forewarning of pending failure on a desk well before it has generated its first full year of results.
The way to set up pre-production scaling is to include the string [+] at the end of the description for the back testing task. The same functionality is available for P&L Attribution.
Back testing results
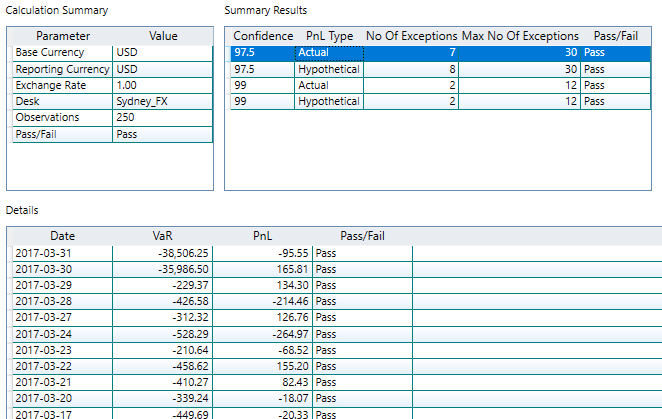
The system reports back testing results at the summary level (global result, and a list of desk results), and at the individual desk level where a back testing graph is produced (report extracts below).
Summary Report
Detail Report